The main macro-components of biogas are:
- methane (CH4) and
- carbon dioxide (CO2)
both are important GHGs that contribute to the intensification of the greenhouse effect.
In particular, over a period of 100 years, methane is characterized by a Global Warming Potential (GWP) 28 times greater than carbon dioxide, as reported in the fifth and last assessment report from the IPPC issued in 2014 and called AR5 (https://www.ghgprotocol.org/sites/default/files/ghgp/Global-Warming-Potential-Values%20%28Feb%2016%202016%29_1.pdf)
Recent NASA publications state that methane concentrations have increased by more than 150% since the start of industrial activities and intensive agriculture and that after carbon dioxide, methane was responsible for about 20% of climate change in the twentieth century (https://svs.gsfc.nasa.gov/4789).
Scientists from all over the world are working to better understand the ‘global balance’ of methane gas with the ultimate goal of reducing greenhouse gas emissions, improving current environmental and climate change forecasts.
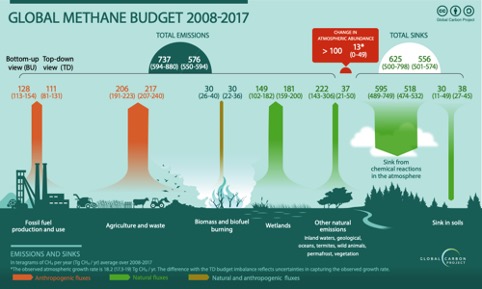
On 15 July 2020, the Global Carbon Project (GCP) published the Global Methane Budget 2008-2017 (https://www.globalcarbonproject.org/methanebudget/index.htm). The chart alongside is taken from the Budget and shows the significant data of the contribution given by the Agriculture and Waste aggregate sectors:

GMB
The United Nations also reiterated that the promotion of climate action has become of primary importance for the entire planet with its press release of 1 February 2021 which states the following: “They are also designed to encourage and facilitate the implementation of ambitious Nationally Determined Contributions (NDCs) under the Paris Agreement, along with the implementation of National Adaptation Plans (NAPs), Long-Term Low greenhouse gas Emission Development Strategies (LT-LEDS), and Global Climate Action and the 2030 Sustainable Development Goals.” (https://unfccc.int/news/regional-climate-weeks-to-drive-forward-climate-action-in-2021-and-2022).
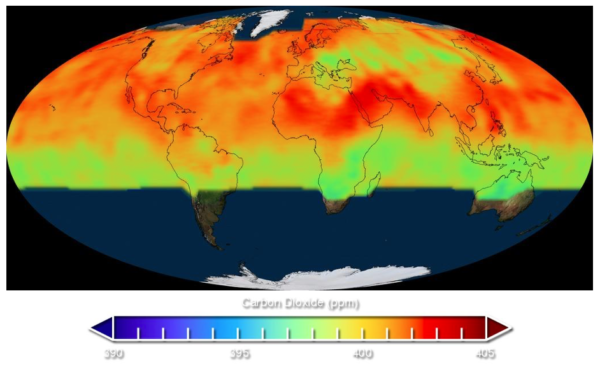
NASA has published some of the most recent data on CO2 and CH4 concentrations in the atmosphere.
For carbon dioxide, please refer to the publications in the link https://svs.gsfc.nasa.gov/4402 from which the ‘static’ Mollweide projection is taken (shown on the right) with the data from the spacecraft from the OCO-2 mission from September 2014 to August 2015 (CO2 data measured in ppm):

NASA
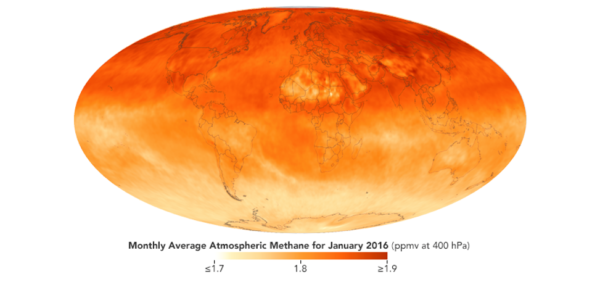
As regards the monitoring of atmospheric methane, ENVISAT (the satellite carrying SCIAMACHY) is no longer operational, but other systems are in use, such as the AIRS infrared atmospheric sounder aboard NASA’s AQUA satellite, operational since 2002. On the right is the NASA Earth Observatory map by Joshua Stevens (https://earthobservatory.nasa.gov/images/87681/a-global-view-of-methane) with AIRS data relating to global methane concentrations in January 2016 at a pressure of 400 hectopascals, or about 6 kilometres above the surface.
Methane concentrations are higher in the Northern hemisphere because both natural and man-made sources of methane are more abundant there.


